- Council of the Great City Schools
- Mirrors or Windows
Featured Reports
Page Navigation
- Crisis Communication Guidebook
- Building Safer School and Communities
- Between the Lines, Large City Performance on NAEP Over the Last 20 Years (2002-2022)
- Supporting Excellence Framework
- Mirrors or Windows
- Investing ARP Funds Blueprint
- Interim Progress Assessment for Federal Relief Funds
- Leadership Transition Guide
- Pandemic-Era Changes in Urban School Leadership
- CGCS Strategic Support Team – Puerto Rico – Special Education
Executive Summary
-
Education is often depicted as one of the best ways out of poverty. At the same time, research over many decades finds that most educational outcomes are strongly correlated to poverty. It is not likely that these two themes are true at the same time. Either schools are windows of opportunity and help overcome or mitigate poverty and other barriers or they are mirrors of society’s inequities. Our question in this report is a straightforward one: Are urban public schools, which have the largest numbers and concentrations of poor students in the nation, windows or mirrors?
The Council of the Great City Schools used the latest ten years of data in reading and mathematics at the fourth- and eighth-grade levels from the National Assessment of Educational Progress (NAEP) to answer this question. What we found suggests that poverty was not necessarily destiny in urban public education. Students in Large City public schools scored higher than predicted on NAEP and showed greater district effects over the study period than other schools in the aggregate across the country. These Large City School students were about 50 percent more likely to be poor, twice as likely to be English learners, twice as likely to be Black or Hispanic, and about 50 percent more likely to have a parent who did not finish high school as students in All Other Schools. Specifically, the analysis showed that—
- Students in Large City Schools narrowed the gap with students in All Other Schools in both reading and math at fourth and eighth grade levels between 2003 and 2019 by a third to a half, depending on grade and subject.
- After considering differences in poverty, language status, race/ethnicity, disability, educational resources in the home, and parental education, Large City Schools had reading and mathematics scores on NAEP that were significantly above statistical expectations at both the fourth- and eighth-grade levels in 2019 (the latest year NAEP was administered) and in most years since 2009.
- After factoring in these variables, students in Large City Schools had significantly higher “district effects” on NAEP than students in All Other Schools in the aggregate.
- District effects in Large City Schools on NAEP were not significantly larger in 2019 than in 2009 in any grade/subject combination, although several city school systems showed significant gains over the period.
- If NAEP and college and career-readiness standards in mathematics were better aligned, then Large City Schools would have scored, on average, about 2.4 scale score points better in fourth-grade and 1.4 points better in eighth-grade in 2019
- Some Large City school districts showed larger district effects in mitigating poverty and other barriers than other Large City school districts.
To explore what drove district progress, the Council conducted site visits to six districts that seemed to do a better job than others in overcoming or mitigating barriers and two counterfactual districts. Case studies of these districts indicated that those who overcame barriers to some extent benefitted from many of the same strategies and characteristics, including strong and stable leadership that was uniquely focused on student instruction; high academic standards and well-defined instructional guidance and support; human capital strategies aimed at raising the capacity of leaders and teachers; the cohesion and differentiation of professional development; the ability to act at scale; strong accountability systems and cultures of collaboration; the ability to see opportunities in the challenges they faced; their district, school and special population strategies; and their community investments and engagement efforts.
- Students in Large City Schools narrowed the gap with students in All Other Schools in both reading and math at fourth and eighth grade levels between 2003 and 2019 by a third to a half, depending on grade and subject.
Findings
-

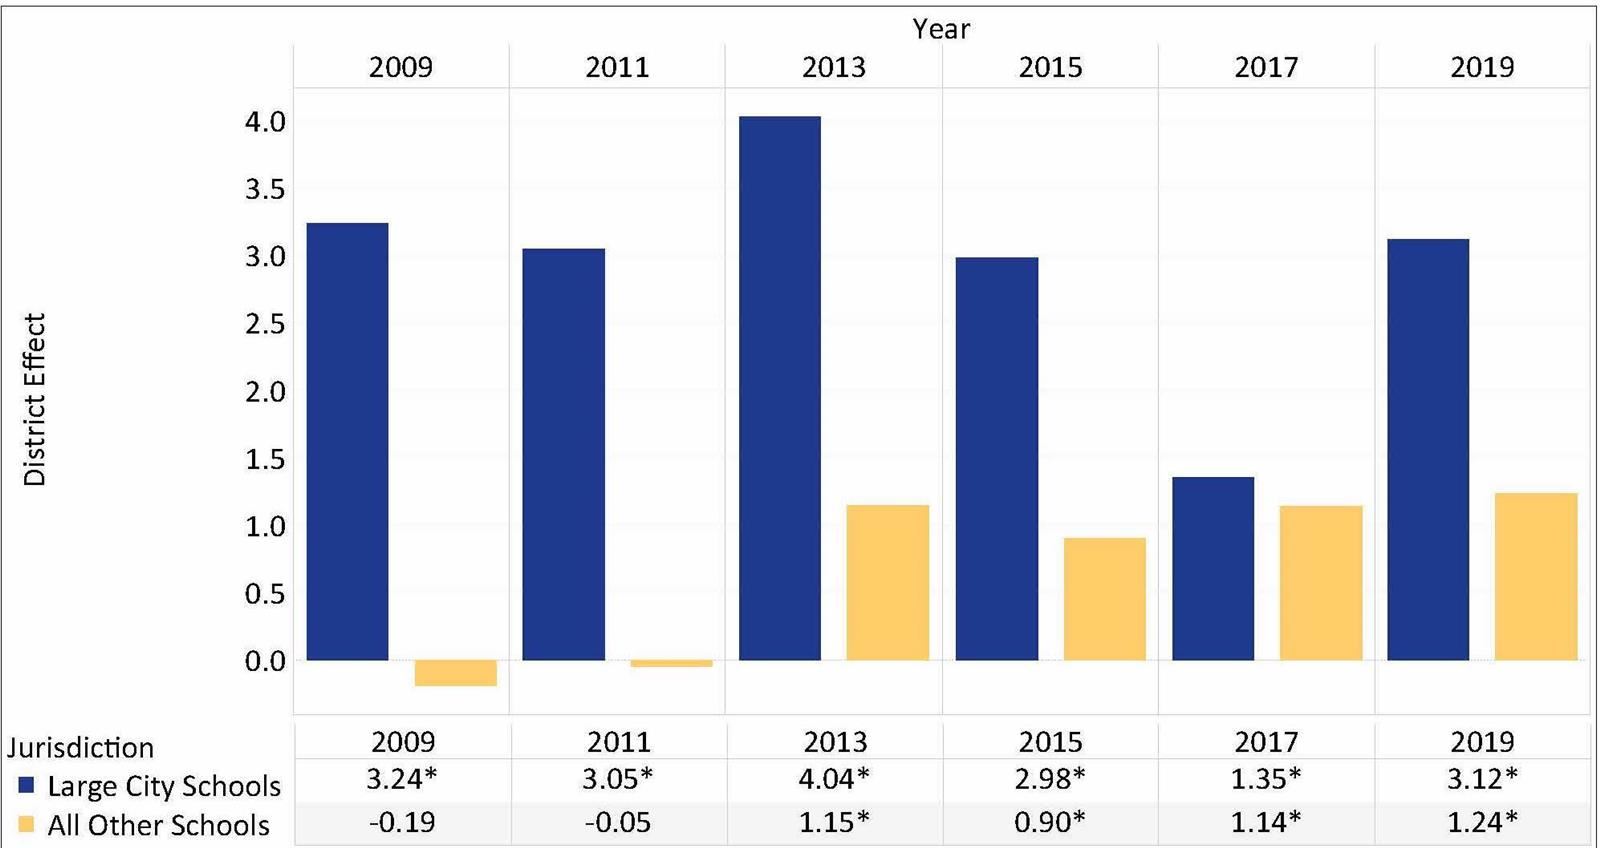
Trends in District Effects† on NAEP Fourth-grade Mathematics by School Type, 2009 to 2019.
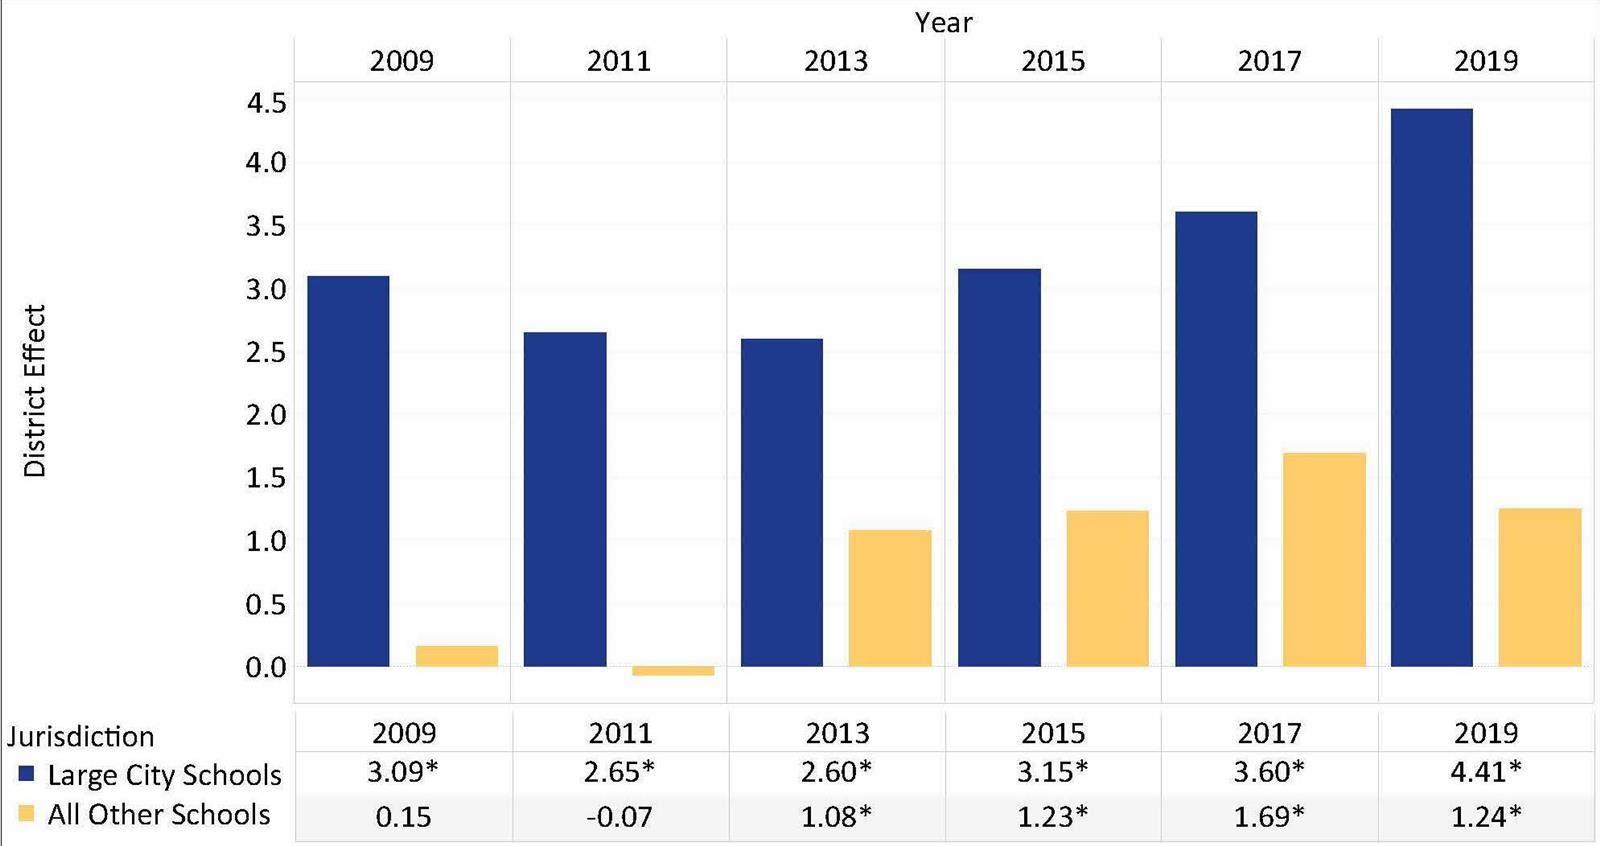
Trends in District Effects† on NAEP Eighth-grade Mathematics by School Type, 2009 to 2019.
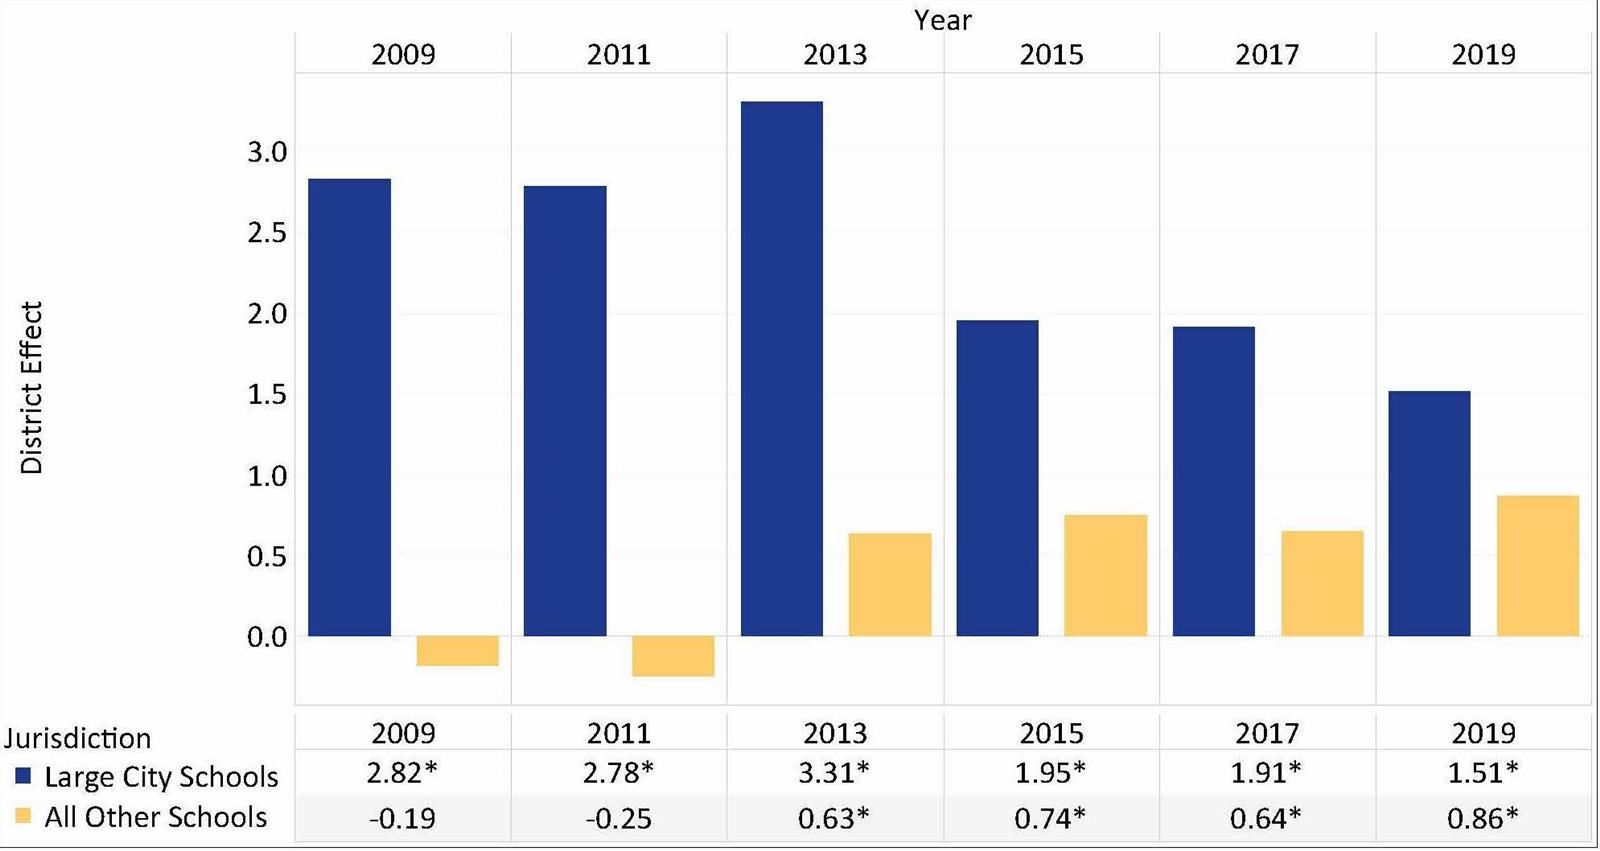
Trends in District Effects† on NAEP Fourth-grade Reading by School Type, 2009 to 2019.
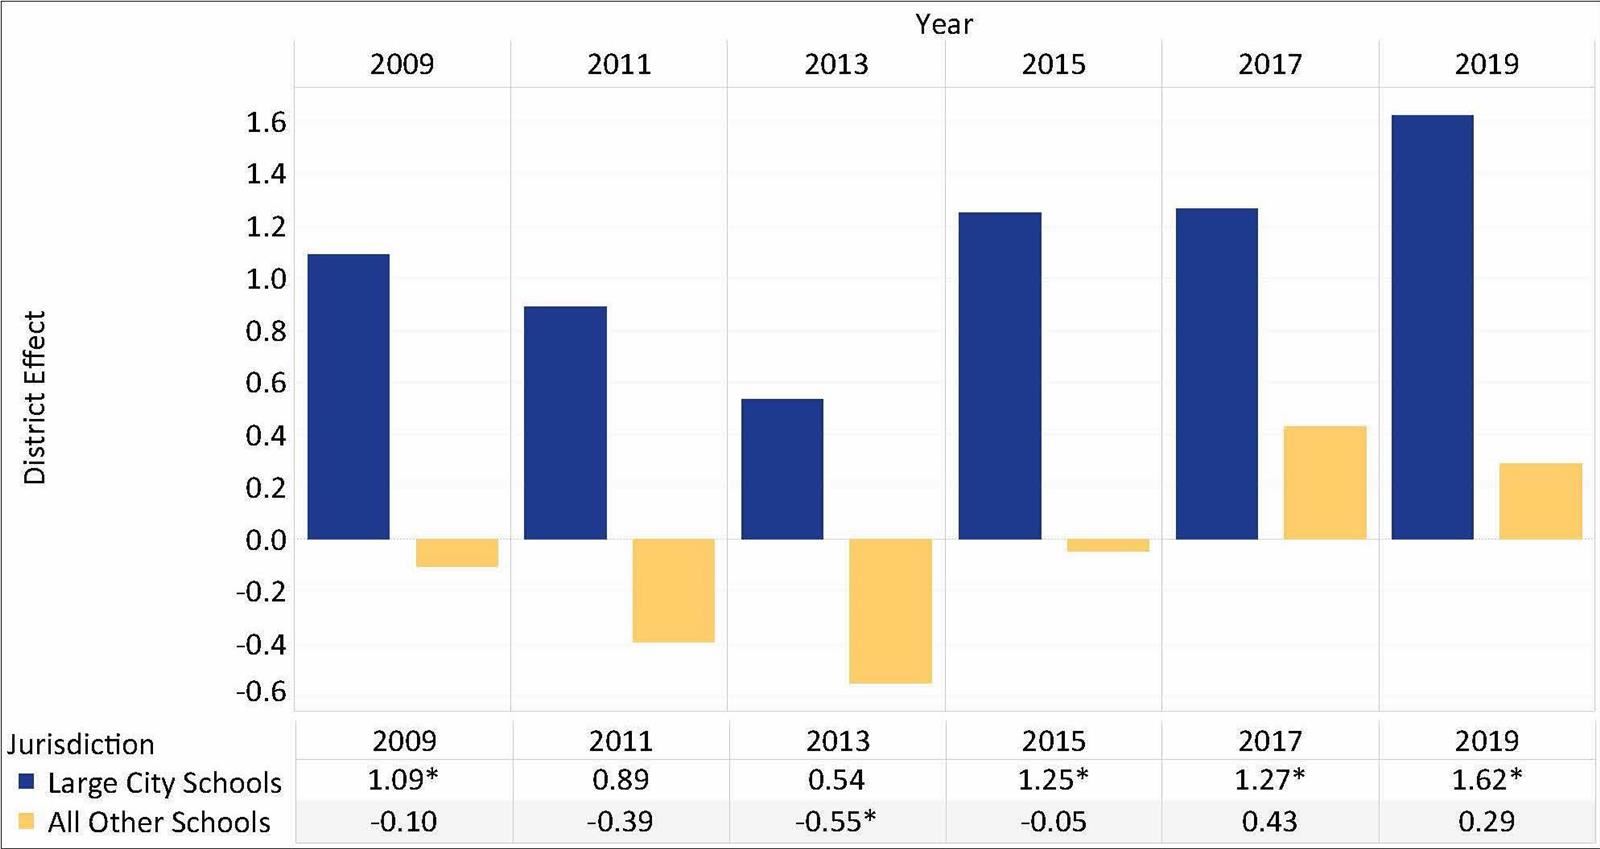
Trends in District Effects† on NAEP Eighth-grade Reading by School Type, 2009 to 2019.
Media Contact:
Contact Name
Contact@email.com
(000) 000-0000
Contact Name
Contact@email.com
(000) 000-0000
Contact Name
Contact@email.com
(000) 000-0000
Media Contact:
Contact Name
Contact@email.com
(000) 000-0000
Contact Name
Contact@email.com
(000) 000-0000
Contact Name
Contact@email.com
(000) 000-0000


