- Council of the Great City Schools
- Achievement
Search for Publications
Page Navigation
Achievement
-
Between the Lines: Large City Performances on NAEP Over the Last 20 Years (2002-2022)The purpose of this brief is to understand differences in student performance between large cities and students nationally over the last 20 years, from 2002 through 2022, as well as after the effect of the COVID-19 pandemic. We also detail the possibilities of large city performance in the years to come.46 pagesOctober 2023
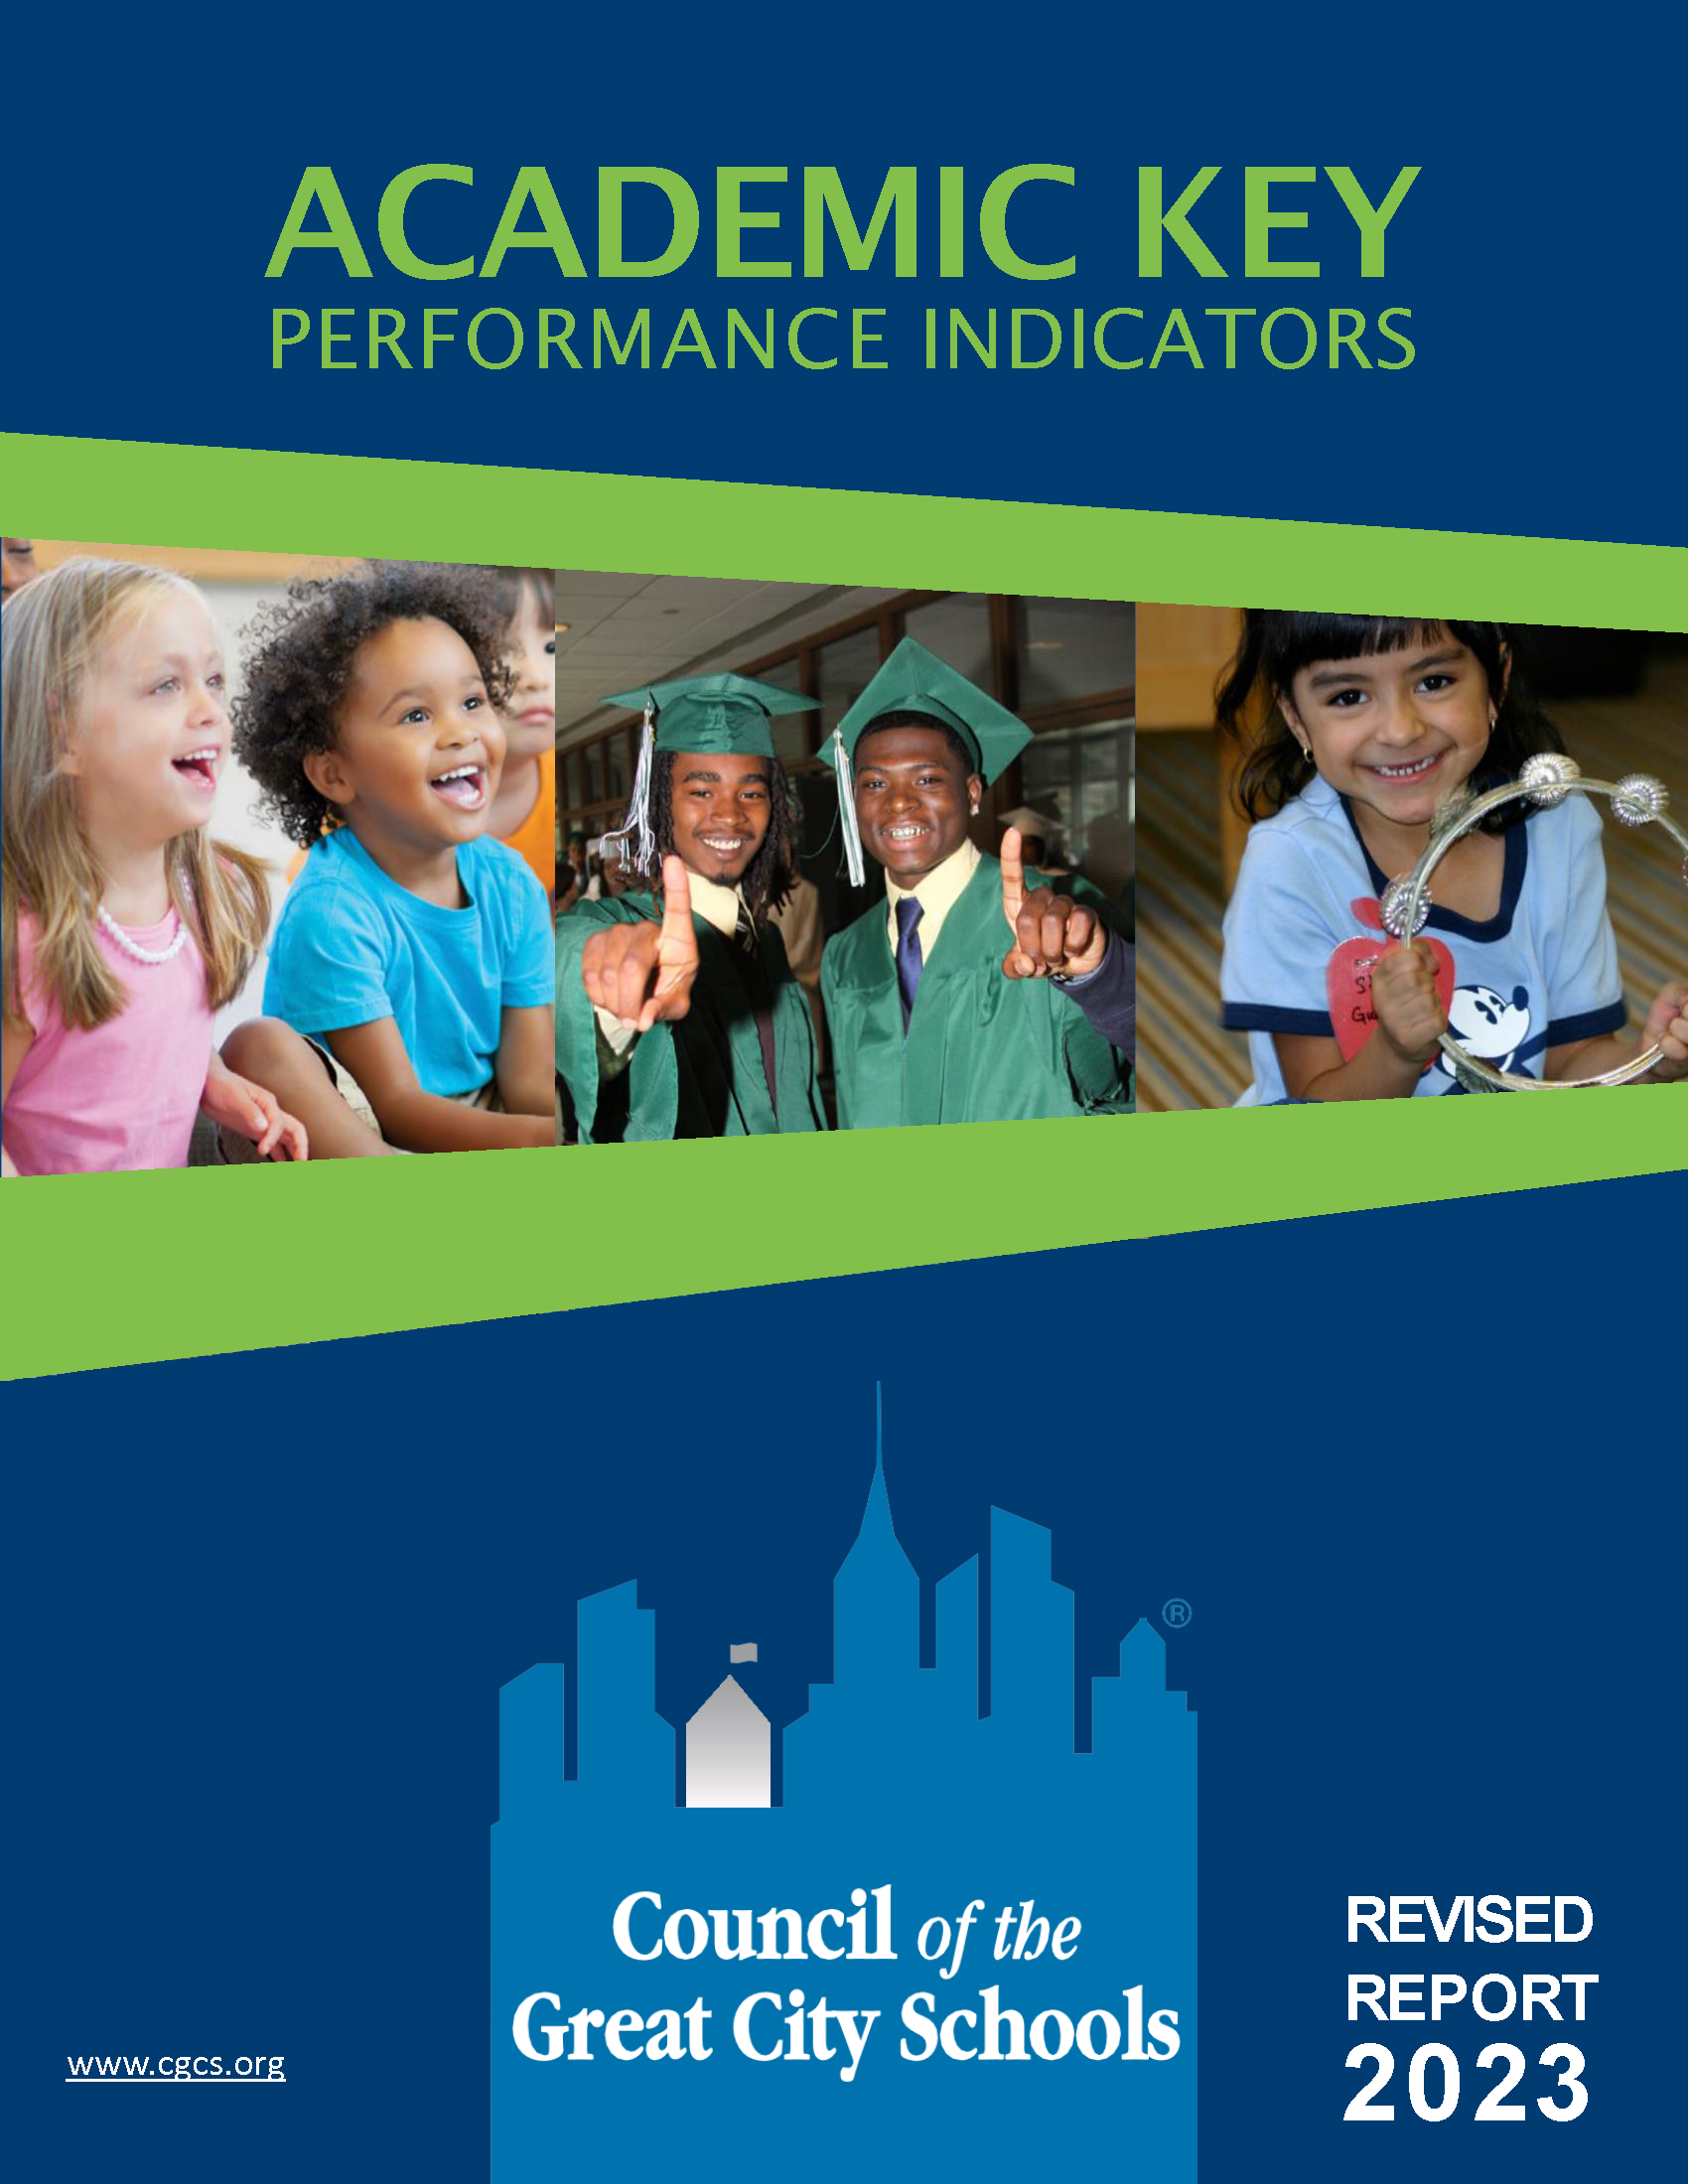 Academic Key Performance Indicators, 2023 ReportThe 2023 report presents an updated set of data for school year 2021-22. This report presents several different ways that member districts can analyze the data themselves by disaggregating results, showing trends, and combining variables. The companion online dashboard has been updated with the most recent data allowing districts to conduct several comparisons and analysis beyond what is presented in this report. To access this system, go to www.edwires.org.196 pagesOctober 2023
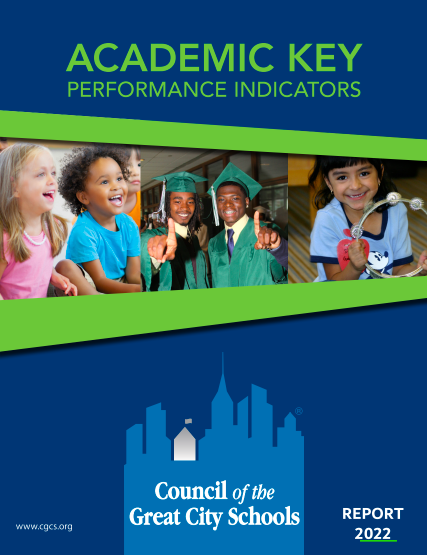 Academic Key Performance Indicators, 2022 ReportThe 2022 report presents an updated set of data through school year 2020-21. This reportpresents a number of different ways that member districts can analyze the data themselves bydisaggregating results, showing trends, and combining variables. The companion online dashboard addsthe ability to conduct several comparisons and analysis beyond what is presented in this report. To access this system, go to www.edwires.org.204 pagesOctober 2022
 Mirrors or Windows: How Well Do Large City Public Schools Overcome the Effects of Poverty and Other Barriers?Over the last twenty years of district-level assessments on the Nation's Report Card, the participating urban school districts have narrowed the achievement gap in mathematics and reading by about 50 percent. The Mirrors or Windows study found that urban students are making significant progress academically, despite having to overcome the effects of poverty.84 pagesJune 2021
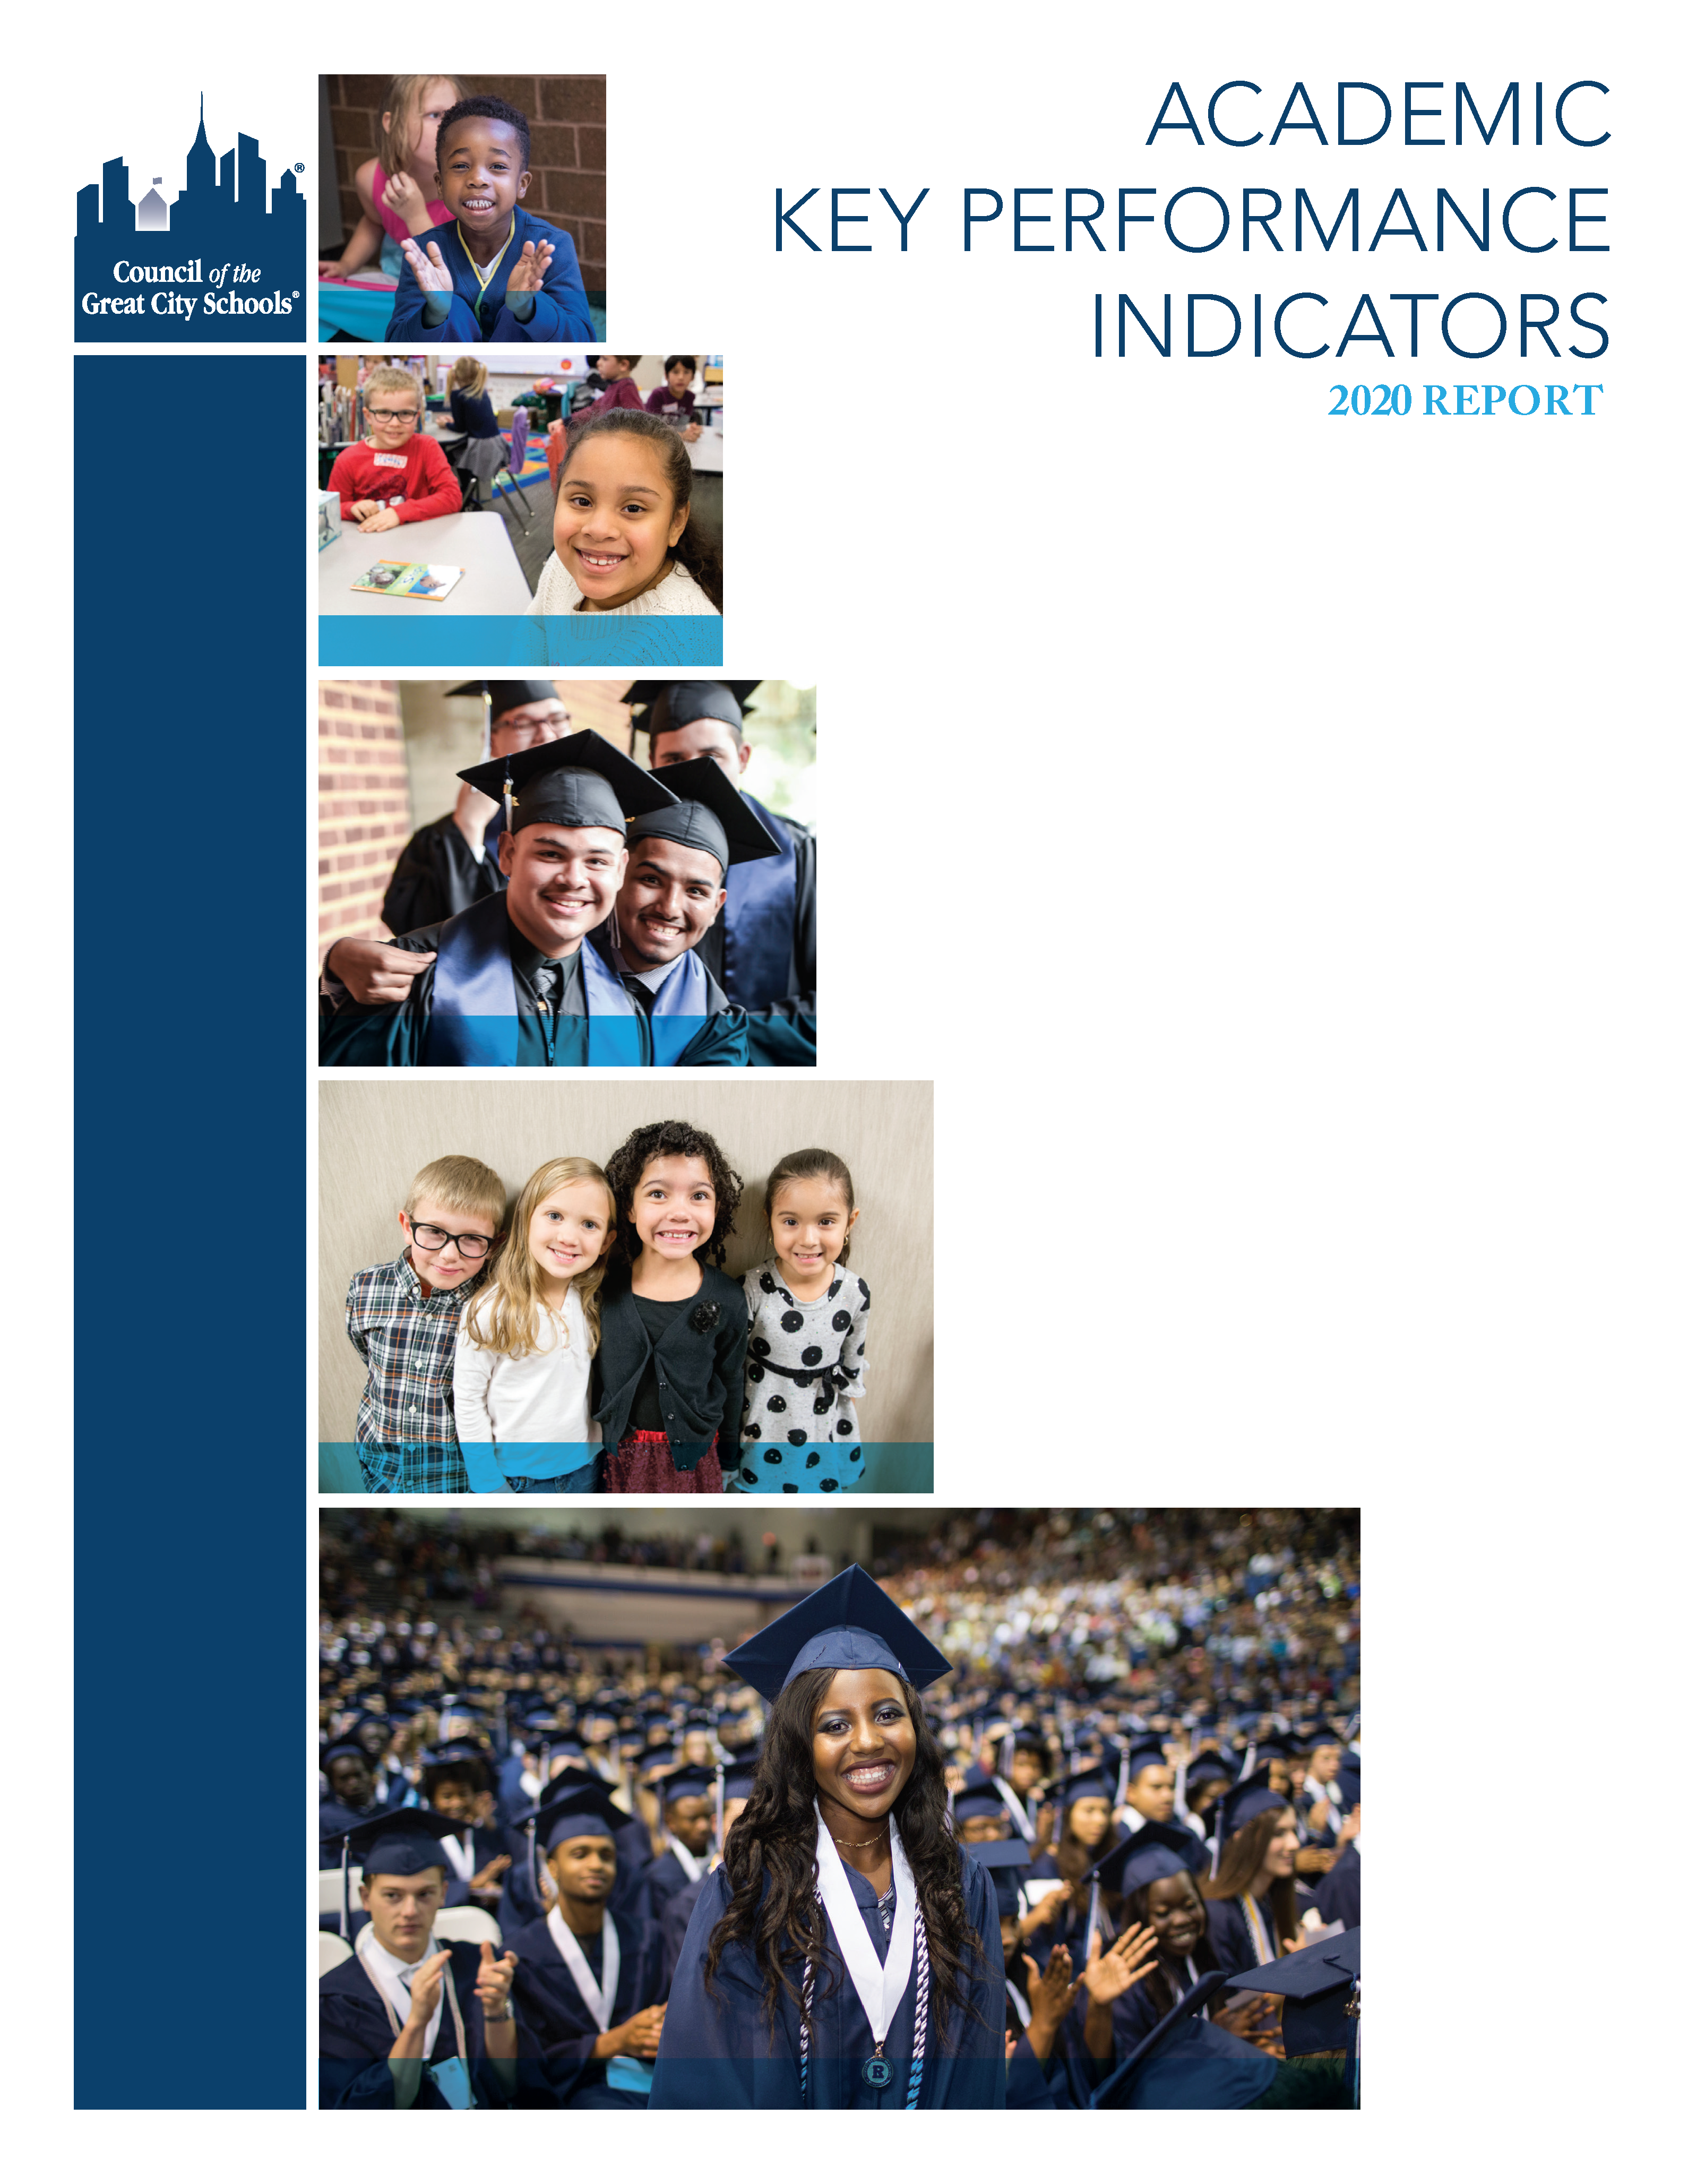 Academic Key Performance Indicators, 2020 ReportThe refined set of Academic Key Performance Indicators are designed to measure the progress among the Council’s membership toward improving the academic outcomes for students.289 pagesOctober 2020
 Academic Key Performance Indicators, 2019 ReportThe refined set of Academic Key Performance Indicators are designed to measure the progress among the Council’s membership toward improving the academic outcomes for students.282 pagesOctober 2019
 Academic Key Performance Indicators 2018 ReportThis 2018 report focuses on the data collection and analysis of Academic KPIs including:• Pre-K enrollment relative to Kindergarten enrollment• Percent of 4th and 8th graders proficient in reading and math on NAEP• Algebra I completion rates for credit by grade 9• Ninth grade course failure rates — at least one core course• Absentee rates by grade level• Ninth graders with B average (GPA) or better• Absentee rates by grade level• Suspension rates• Instructional days missed per student235 pagesOctober 2018
 Excellence for All: Creating Environments for Success for Males of Color in the Great City SchoolsThis report seeks to contribute to the ongoing dialogue of raising our expectations for males of color and provide a resource for school districts seeking to build or recalibrate their initiatives to improve the academic outcomes of young men and boys of color. Throughout this reportthere are exemplars of current initiatives across the nation’s big cities as well as promising practices in various areas.36 pagesOctober 2017
Media Contact:
Contact Name
Contact@email.com
(000) 000-0000
Contact Name
Contact@email.com
(000) 000-0000
Contact Name
Contact@email.com
(000) 000-0000
Media Contact:
Contact Name
Contact@email.com
(000) 000-0000
Contact Name
Contact@email.com
(000) 000-0000
Contact Name
Contact@email.com
(000) 000-0000

